Well the answer is pretty simple. I've altered the way I trade a little. One of the great things about doing the blog is I get a lot of emails from other Betfair users and get to chat to a lot of people on MSN whose opinions I respect. My style of trading was very much one of get in and out of a market very quickly, often within seconds, nicking a few ticks along the way. The trading software I use made this possible, and it meant I was usually making small profits on the events I traded. They were consistent, but perhaps I was not being as efficient as I could be.
Anyway, one of the topics that was continually cropping up was why don't I let my winning trades run longer? Afterall, it's one of the great sayings in Financial markets that you should run with your profits and cut your losses. So I decided to give this a go. It's quite startling what this subtle change has resulted in. Perhaps the best way to show this is the graph below, which shows my profit / loss in relation to the number of markets traded since I started the blog. (Just click the picture for a bigger version)
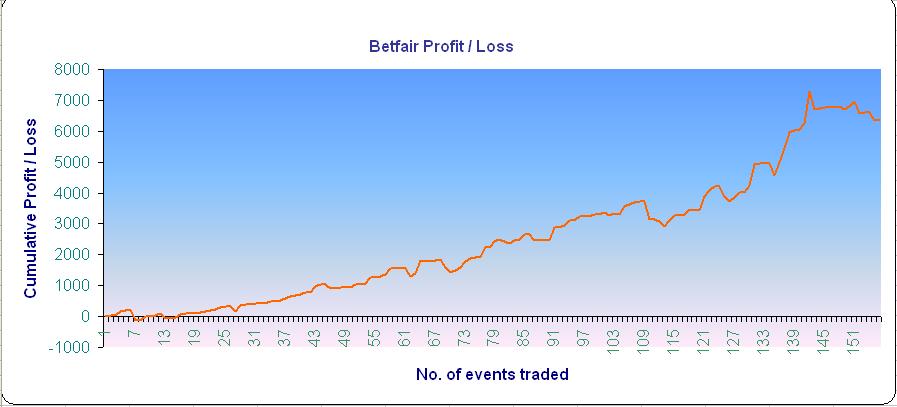
I guess the first thing to note is that's quite a lot of events! But many of them are just ones I dip into for a single trade or two. I'm not actually trading the entire event. I'd had some time off trading when I started the blog so initially used blocks of £250 just to get me back into it. But from somewhere around Event 10 I started using my regular £500.
Anyway, the interesting thing is this. It's pretty clear just from looking at the graph when I switched to letting my wins run for longer. On first impressions it looks like around Event 109, which is where the gradual climb in profits finishes. The turn point was actually around Event 120 and the dip before that, from Event 109, was a bad patch I went through that I have discussed previously.
Until the switch the profit grows in a pretty smooth consistent manner. There are ups and downs but the trend is pretty clear. After the switch the consistent growth disappears. There are some very big wins which see the profit line turn much steeper. But some of the losses are also much bigger than usual. Basically there is far less consistency in the results, as evidenced by the patch from around Event 142 onwards.
I guess that's partly what is to be expected. Though the irony is, if I put a trend line on the graph the finishing profit position is almost exactly where I'd expect it to be if I hadn't made the change to letting my wins run. (It's actually just above) The trouble is, if my wins are as bigger as they have been I should be further ahead. Which leads me to think I'm doing something wrong.
And, of course, I am. And my mistake is this. Although I'm letting my wins run, I'm also letting my losses run longer than I used to. This explains the recent spate of heavier losses, especially in tennis where the markets often move a lot quicker than in cricket. Trading my old way I used to cut losses very quickly. But in letting my wins run I've also started to let my losses run too far. The solution is, of course, simple. Just cut the losses like I used to. Hopefully then the profit figure will continue to increase more sharply than in the original steady growth period and I can save funds quicker for the big day!
So what does it all mean?
Well, this may all be very boring to some of you but has been a good exercise for me. It shows that what I was doing was profitable. But perhaps was not the most efficient use of my time. The graph clearly shows the benefits of letting my wins run longer. My mistake has been to let my losses run longer too. Show the same discipline in cutting them as quickly as I used to and hopefully I can start winning at an increased rate.
Popular links: Betfair trading software .....Bookmaker Free Bets.....Bet365
3 comments:
Nice idea to include the graphs!
Cool idea
Smiled the Assassin
If you send me the spreadsheet
I will sort you with a real cool 'flash chart'
I lost 981 this week
but have hopefully won a good bit back
Thanks to Mr T
Phil
Cheers for the comments guys. SA> That particular graph was just the easiest way to show that letting the wins run is beneficial as long as you maintain the same discipline in cutting losses. I know the data set isn't really enough to draw the conclusion but I know it's right and will no doubt do an update in another 50-100 events time.
Don't worry about the £981. Not good to lose but I've had some pretty big losses too recently and going on past form I'm sure you'll recoup that if you stick to the basics.
I just truly love personal introspection and truly believe is the best way to suceed and to get better...
Keep up the excellent job, not only in terms of profitability but also on the excellent blog you have and continue to do...
stay excellent, talk soon
Post a Comment